

Consulting firm The Hackett Group publishes an excellent and closely watched report on working capital at North American firms. This year’s report was released recently, and we’re discussing some key insights here. You can find the full report at thehackettgroup.com.
A good year for earnings, a worse year for cash
The 1,000 largest public companies in North America just posted their best margins in 13 years, and at the same time tied up more cash in working capital than ever before. That is the central finding of The Hackett Group’s 2026 North American Working Capital Survey, which analyzes the FY2025 financial statements of the 1,000 largest nonfinancial companies headquartered in the region.
Revenue rose 6% to $17.6 trillion, net income margin reached 10% and EBITDA margin 21%. Yet the cash these companies could release by matching top-quartile working capital performance in their industries rose 12% to a record $1.94 trillion, reversing three years of improvement. Net working capital rose to 11% of revenue. Profitability and cash efficiency have come apart, and the one lever that held the line last year is close to its limit.
A flat cash conversion cycle that hides deterioration
The cash conversion cycle (CCC) shortened by 0.2 days, from 38.6 to 38.4. The components tell a different story. Days sales outstanding worsened 2.1 days, the third consecutive year of deterioration, with collections declining in 40 of 50 industries. Days inventory outstanding rose 0.6 days as companies carried buffer stock against tariffs and supply uncertainty. Days payable outstanding improved 2.9 days to its strongest level since 2021, and that single move produced the entire headline improvement.
Because the cycle is counted in days, it says nothing about how many dollars are sitting inside it. Receivables grew 11% against revenue growth of 6%, and the cycle held steady while the cash tied up in it rose.
Where the $1.94 trillion sits
Hackett’s opportunity figure is the gap between each company’s DSO, DIO and DPO and top-quartile performance in its industry, converted to cash. It is a benchmark gap, not a pool of cash waiting to be released. Receivables, at $773 billion, are both the biggest piece and the one growing fastest: up 29%, and now 40% of the total; inventory is $616 billion, up 6%; payables were flat at $548 billion. Receivables accounted for more than four-fifths of the year’s $210 billion increase.
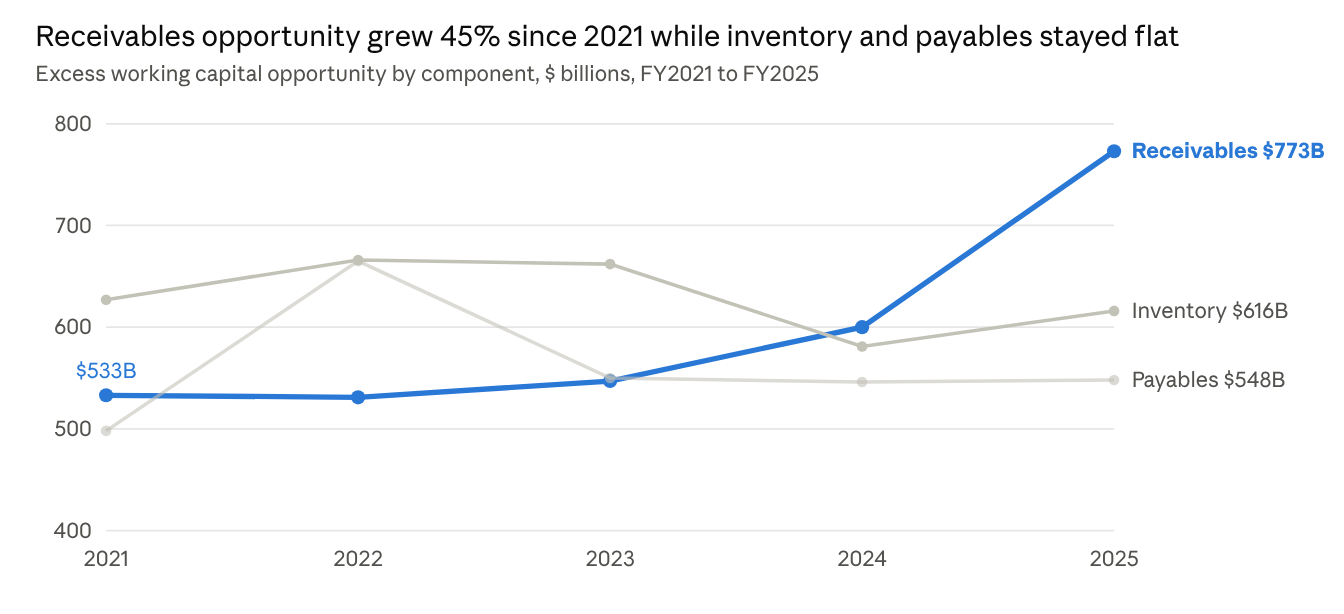
Hackett separates two sources of receivables pressure. The structural kind is the product of commercial decisions: the terms a company agreed to, how concentrated its customer base is, and how much leverage those customers hold. If a major account makes longer terms a condition of the business, the supplier has effectively lent that customer money for free, and no collections team can get it back ahead of the due date. The operational kind is different: poor credit decisions, order errors, disputes and slow cash application. Only the operational share can be fixed by running the process better.
Some sectors show how far the structural side can go. In computer hardware, receivables grew nearly three times as fast as revenue (58% versus 21%); in media, advertising and publishing the ratio was more than seven to one (52% versus 7%).
Inventory follows a similar pattern on a smaller scale. Companies built safety stock as insurance against tariffs, doubled up on inventory from existing and replacement suppliers during the switchover, and bought ahead of expected duties. Part of that is a conscious trade of balance sheet efficiency for supply certainty; part may simply be excess. The financial statements cannot tell the two apart.
Payables carried the year, and scale decided who benefited
Payables were the one clear success, and the gains went to the largest companies. The $10 billion-plus revenue tier stretched DPO by roughly 5% and was the only group whose CCC got better. Everyone else went backwards: CCC worsened 2.5% in the $5 billion to $10 billion tier and 3.2% below $5 billion. Hackett reads this as a scale effect. The biggest buyers have the purchasing power to dictate terms, which means the liquidity squeeze moves up the chain to their suppliers.
That is the problem with payment terms on their own. Every day of DPO a buyer gains is a day of DSO on a supplier’s balance sheet, usually a smaller company with fewer financing options. Hackett is direct about where this ends. There is a ceiling on how far terms can be pushed before suppliers price the delay back into what they charge, and the buyers with the most leverage have, in the survey’s words, “already used it.”
Sustained improvement is rare. Of the 1,000 companies, 98 improved CCC three years running, nine for five years, and two for seven. One-year gains are easy to find because the usual moves, stretching terms, working down inventory, a push on collections, each work initially but eventually stop giving.
What Hackett says about supply chain finance
In its discussion of payables, the survey singles out one tool. Supply chain finance, it says, “calls for particular attention here because it changes what an extended DPO means. Under a well-designed program, the buyer retains its negotiated payment date while a financial institution gives participating suppliers the option of being paid earlier. The supplier’s DSO can therefore improve even as the buyer’s DPO remains extended.”
For the buyer, the working capital effect comes from terms: a 15-day extension on $500 million of annual spend releases roughly $21 million; on $5 billion, roughly $208 million. For the supplier, the benefit is availability. It gains working capital it can draw on as needed, on any approved invoice, without a credit application, collateral or added debt. Much of the $773 billion receivables gap is structural, built from longer terms accepted to win business from large customers, and collections cannot recover that cash early. An early payment program can, on the supplier’s schedule.
One caveat on reach. Traditional programs required the buyer to sign an irrevocable payment guarantee, which generally limited them to investment-grade buyers and their largest suppliers. Newer programs, including IFG’s, replace the guarantee with data-driven credit limits for each buyer-supplier pair, which removes the investment-grade requirement, leaves the buyer’s AP process and accounting treatment largely untouched, and lets suppliers onboard in a single session. That matters for the mid-sized companies in Hackett’s data, which deteriorated on every measure.
Hackett’s prescription, and where SCF fits in it
The survey’s broader recommendation is not about any one lever. Hackett’s argument is that the $1.94 trillion is “a benchmarked performance gap, not a diagnosis of a single failure or a pool of cash that can be released through one intervention,” and that lasting gains require rebuilding the full chain of processes behind working capital rather than tuning any single lever, with order-to-cash the place to begin. Its recommended approach, in brief:
- Start with a benchmark. Measure each of the three metrics against the top quartile of the industry and put a dollar figure on the shortfall.
- Find where the cash is stuck, and why. Distinguish terms a company chose to accept from process breakdowns it could have avoided.
- Rank the opportunities. Weigh the size of the prize against how hard each fix is, what technology is already in place and what the return looks like.
- Rebuild the process, do not just automate it. Layering tools onto a broken workflow brings the same friction back.
- Sequence the work. Line up process, data, systems, governance, roles and metrics together so the improvement sticks instead of fading the following year.
Supply chain finance sits inside step two. It answers one structural problem: payment terms that one side needs and the other cannot easily carry. It does not fix a buyer’s own receivables, reduce inventory or improve collections; those are order-to-cash problems. What it does is make a given set of terms sustainable for suppliers, so the payables lever can be held without the pricing response Hackett warns about and without pushing the cash problem down the supply chain.
In 2026, rates stayed in the mid-4% range, tariffs broadened, and both point toward a longer cycle. But Hackett’s closing point is that conditions set the difficulty, not the outcome. Companies facing the same rates and tariffs tie up very different amounts of cash. The ones that improved for several years running treated working capital as a connected process rather than three annual targets, and used tools like supply chain finance for what they are good at.
Sources: The Hackett Group, 2026 North American Working Capital Survey, based on FY2025 financial statements of the 1,000 largest nonfinancial public companies headquartered in North America. Working capital release figures are illustrative.